Welcome to DNG Inc.
We are a multinational firm offering expert consultancy and advanced solutions, backed by a team with over 30 years of experience in technology and data.
Scalability
Our solutions are designed to be scalable, allowing you to grow your business without worrying about outgrowing your software.
Growth Strategy
We analyse your operations and offer proactive suggestions to boost productivity, streamline processes, and increase revenue.
Multi-Tech Stack Proficiency
Our developers have expertise in various technologies, providing a diverse range of solutions to meet your specific requirements.
Quality Delivery
We prioritise service excellence, aligning our solutions with your objectives, and exceeding expectations. We remain committed to your satisfaction throughout the project cycle.


How We Work With You

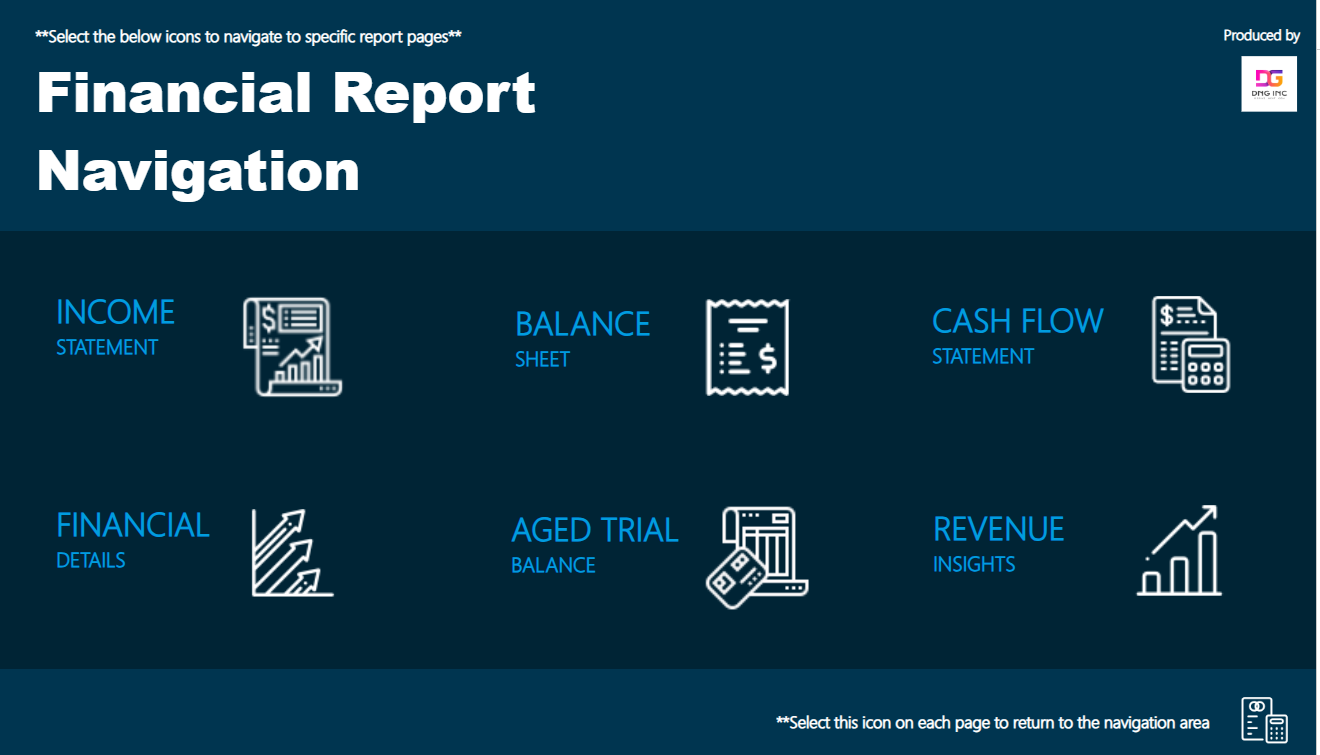
Business Intelligence
Our business intelligence development services provide comprehensive solutions for managing and analysing critical business data, allowing valuable insights into their operations and make data-driven decisions.
Learn More
Data Visualisation
Our data visualisation services encompass technology consulting, implementation, and support, delivering stunning interactive reports with intelligent and visually appealing designs.
Learn More
Data Warehouse
Our data warehouse services encompass consulting, design, development, QA, migration, and modernisation support to deliver a robust and optimised data warehousing solution.
Learn MoreExperienced Team
Our team brings over 20 years of proven experience into every project, ensuring the highest of level of quality.
Dedicated Support
We provide dedicated support to deliver quality services, acting as an extension of your company to achieve your business objectives.
Cost-Effective
We provide unbeatable prices and exceptional service to businesses of all sizes. Choose our value-driven approach to take your business to the next level.
Our Developers Are Certified


Things You Get
In-depth Feedback
Our in-depth feedback loops ensure consistent quality and client satisfaction.
Accessible and Responsive
Our team is always available to support your business needs.
Results-Driven Solutions
Our objective-oriented approach ensures your business goals remain at the forefront of every project.
Worldwide Reach
Our global delivery capabilities ensure consistent, high-quality service across all regions.
Your Trusted Partner
We treat your business like our own, providing tailored solutions to meet your unique needs.
Engineering Excellence
Our products are built with precision and care to provide you with top-quality technology solutions.


