Consumer Goods Sales
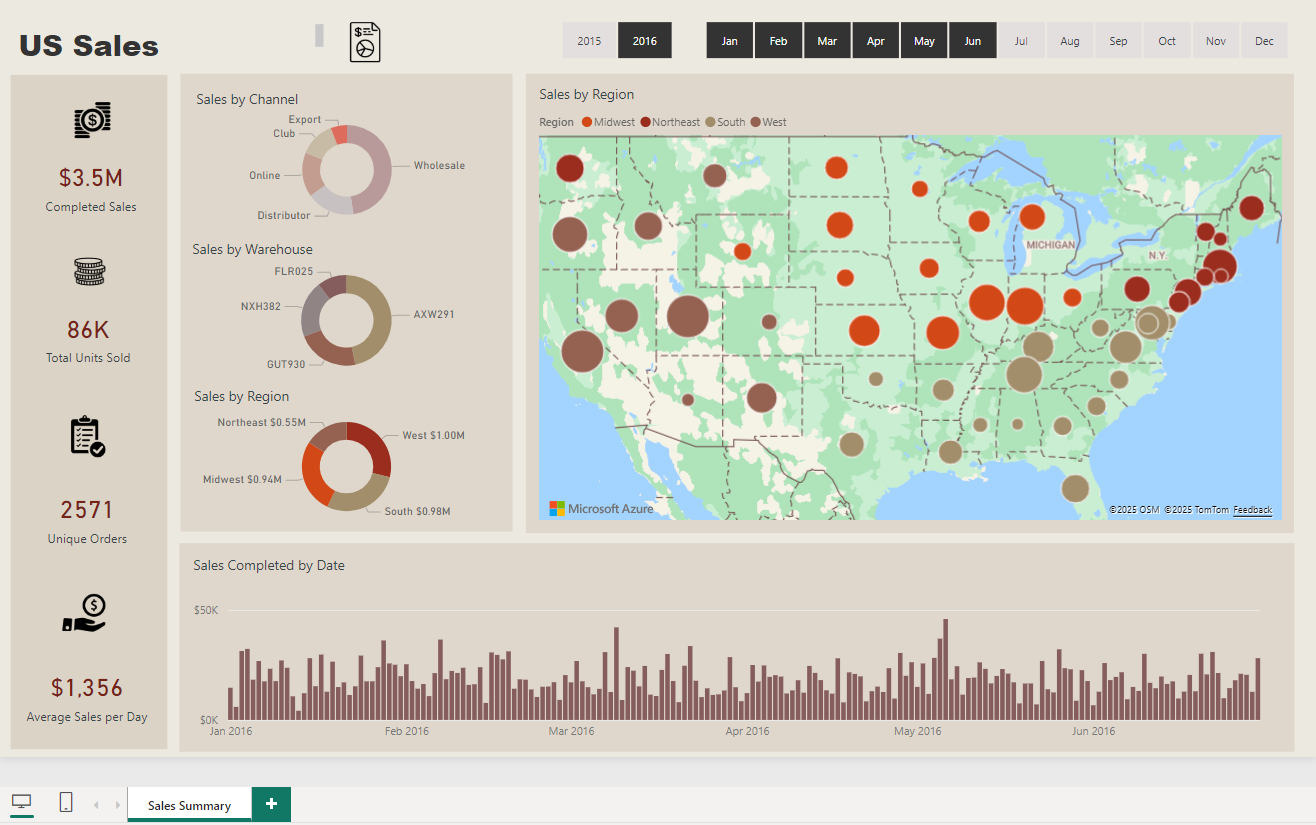
- Displays key metrics such as total sales, revenue, units sold, and average order value.
- Includes visual summaries like bar charts or line graphs to show sales trends over time (daily, weekly, monthly).
- Highlights the best-selling products based on revenue, units sold, or profitability.
- Features sortable lists or interactive charts to drill down into product-specific performance.
- Provides a geographical breakdown of sales, showing which regions or territories are performing best.
- Uses heat maps or geo-maps to visually represent sales distribution across different locations.
-------------------------------------------------------------------------
Our Developers Are Certified


