Financial Dashboard
- Provides a summary of the financial performance, including key metrics like revenue, profit, expenses, and cash flow.
- Often includes visual aids such as charts and graphs for a quick understanding.
- Displays the company’s revenues, expenses, and profits over a specific period.
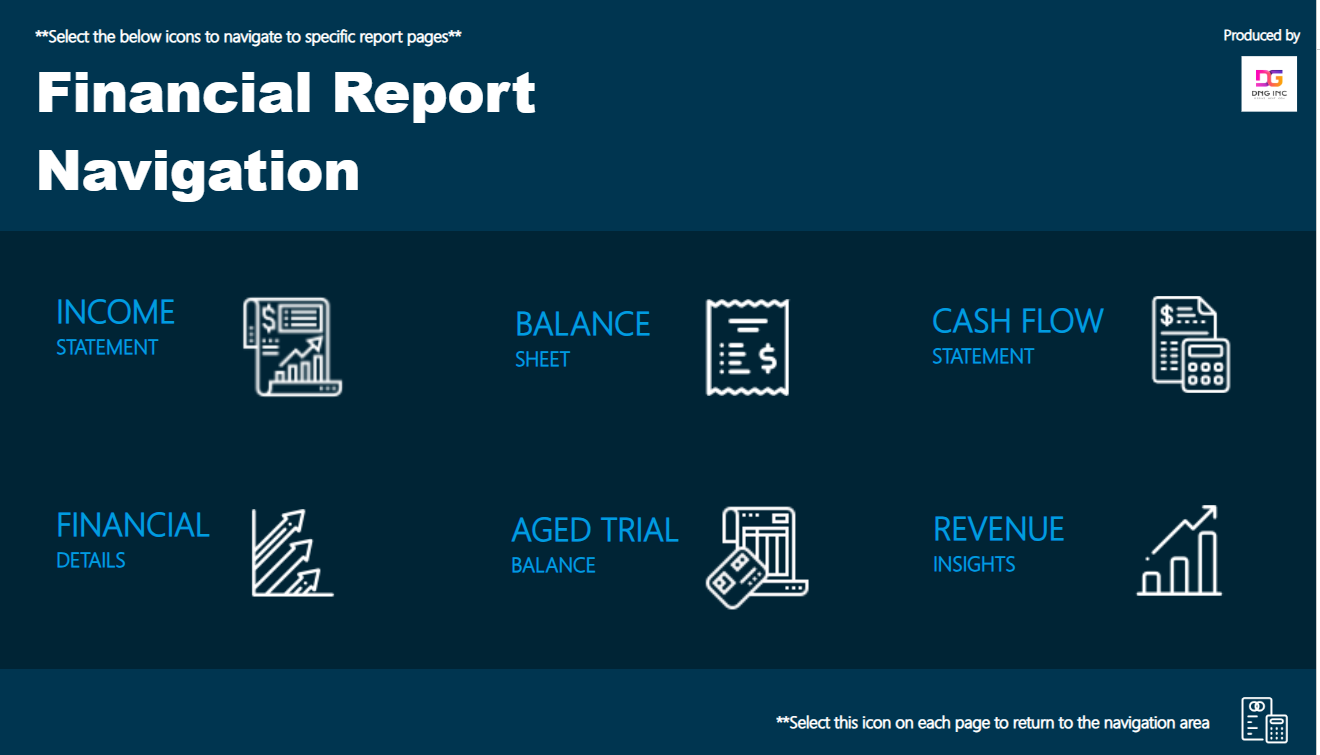
- Navigation allows users to drill down into individual categories for more details.
-------------------------------------------------------------------------
Our Developers Are Certified


